

一、顶层数据流图
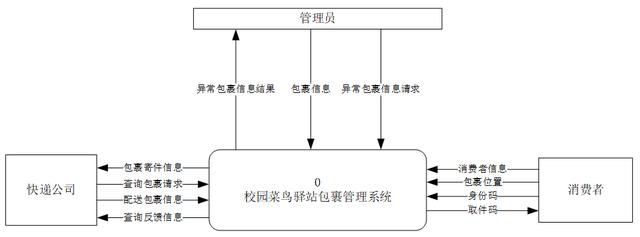
通过顶层数据流图,可以看出该系统一共由三个外部实体(管理员、消费者、快递公司)组成。消费者将消费者信息、包裹位置、身份码输入给校园菜鸟驿站包裹管理系统,该系统又将取件码输出给消费者;
管理员将包裹信息和异常包裹信息请求输入给该系统,该系统又输出异常包裹信息结果给管理员;快递公司输入查询包裹请求和配送包裹信息,该系统输出包裹寄件信息和查询反馈信息给快递公司。
二、0层数据流图
由0层数据流图可以看出校园菜鸟驿站包裹管理系统一共有5个子系统(寄件系统、包裹查询系统、取件系统、异常包裹处理系统)构成。
0层数据流图的描述如下:
首先消费者将消费者信息输入给订单管理系统,由订单管理系统提供的订单表返回订单表输出订单信息给寄件系统,寄件系统输入包裹寄件信息给快递公司;
快递公司寄出快递后,将配送包裹信息输入给包裹查询系统,同时快递公司也可以申请查询包裹请求,再由包裹查询系统返回查询反馈信息给快递公司;
当包裹到达菜鸟驿站后,取件系统将取件码发送给消费者,消费者根据包裹位置和身份码进行取件;当包裹出现异常时,管理员发出异常包裹信息请求,再由包裹查询系统提供的包裹信息表输出包裹信息给异常包裹处理系统,异常包裹处理系统再将异常包裹信息结果返回给管理员。
三、1层数据流图
通过对寄件系统的进一步分析,寄件系统分为了包裹信息核查系统、订单生成系统、包裹寄出通知系统。
1层数据流图分析如下:
订单表将订单信息输入给包裹信息核查系统,核查通过后,该系统输出包裹信息给订单生成系统;之后订单生成系统将订单信息输入进包裹寄出通知系统,包裹寄出通知系统又将包裹寄件信息发送给快递公司。
翻译成英文:
Analysis of rookie station parcel management system based on data flow graph
1. Top-level data flow diagram
From the top-level data flow diagram, it can be seen that the system consists of three external entities (administrator, consumer, courier company).
Consumers input consumer information, package location, and identity code into the campus rookie station package management system, which in turn outputs the pickup code to consumers;
The administrator inputs the package information and abnormal package information request to the system, and the system outputs the abnormal package information result to the administrator;
the express company inputs the query package request and delivery package information, and the system outputs the package delivery information and query feedback information to the administrator. courier company.
2. Layer 0 data flow diagram
From the 0-layer data flow diagram, it can be seen that the campus rookie station package management system consists of a total of 5 subsystems (delivery system, package inquiry system, pickup system, and abnormal package processing system).
The description of the layer 0 data flow graph is as follows:
First, the consumer inputs the consumer information into the order management system, the order table provided by the order management system returns the order table to output the order information to the delivery system.
And the delivery system inputs the package delivery information to the courier company;
After the courier company sends the express, the delivery package information is input into the package inquiry system, and the courier company can also apply for a package inquiry request.
And then the parcel inquiry system returns the inquiry feedback information to the courier company;
When the package arrives at the rookie station, the pickup system will send the pickup code to the consumer, and the consumer will pick up the package according to the package location and identity code;
when the package is abnormal, the administrator sends a request for abnormal package information, and the package query system The provided package information table outputs the package information to the abnormal package processing system.
And the abnormal package processing system returns the abnormal package information result to the administrator.
3. Layer 1 data flow diagram
Through further analysis of the delivery system, the delivery system is divided into a package information verification system, an order generation system, and a package delivery notification system.
Layer 1 data flow graph analysis is as follows:
The order form inputs the order information into the package information verification system. After the verification is passed, the system outputs the package information to the order generation system;
then the order generation system inputs the order information into the package delivery notification system, and the package delivery notification system sends the package. The information is sent to the courier company.
素材来源:百度、知乎
翻译来源:谷歌翻译?
本文来自兔斯基投稿,不代表胡巴网立场,如若转载,请注明出处:https://www.hu85.com/327102.html
相关推荐
版权声明:本文内容由互联网用户自发贡献,该文观点仅代表作者本人。本站仅提供信息存储空间服务,不拥有所有权,不承担相关法律责任。如发现本站有涉嫌抄袭侵权/违法违规的内容, 请发送邮件至 xxxxx@qq.com 举报,一经查实,本站将立刻删除。